TILLS Frequently Asked Question: Age and Grade Equivalencies
March 13, 2025
 If you’re a user of the Test of Integrated Language & Literacy Skills™ (TILLS®), you may have wondered why TILLS doesn’t include age and grade equivalencies for interpreting scores. Today we’ve asked TILLS co-author Elena Plante and TILLS consultant/trainer/research team member Michele Anderson to provide an answer to this frequently asked question. Read on for their detailed response!
***
From time to time, the authors of TILLS get queries from colleagues asking why we don’t include age and grade equivalencies for interpreting scores. With descriptors like “age” and “grade,” it would seem that this could be an easy and forthright way to communicate to parents, teachers, and other non-clinical parties how a student performed. Tests can provide us with a lot of numbers and scores. Making meaning of it all and communicating interpretations to others comes with challenges. Sometimes describing what standard scores mean and how standard deviations work can be daunting—and, after all, some other tests give age and grade equivalencies.
The biggest reason for not including age and grade equivalencies is that they aren’t what they say they are. This has to do with their inherently poor validity because of the way they are derived. For example, let’s look at 8-year-old age equivalencies. All the scores for 8-year-olds (8:0-8:11) are gathered and then a mathematical division is used to create 1-month intervals. So, children who are in the interval designated as 8 years, 4 months can range in age from 8 years 0 months to 8 years 11 months. Yet, we arbitrarily refer to scores at this level as indicating skills at 8 years, 4 months.
But wait. It gets worse. It is very common for the distributions at adjacent ages to overlap—meaning there is overlap between the distributions of children between the ages of 7 years and 8 years, and 8 years and 9 years. So how is this inconvenience to be handled?
The point at which these the age 7- and 8-year-old distributions cross would simply be designated as reflecting 8 years, 0 months, even though there are typical 8-year-olds who score lower than this and 7-year-olds who score higher. But these typical 8-year-olds will now be assigned age scores in the 7-year-old range. Likewise, the point at which the 8-year-olds cross with the 9-year-olds at the upper end is now designated as 9 years, 0 months, even though there are typical 8-year-olds scoring above this point and typical 9-year-olds scoring lower.
At this point, age scores typically bear little resemblance to what children at that age actually score. It is not uncommon for normative distributions at adjacent ages to be separated by only a few points. Because age- and grade-equivalent scores are calculated in the same way, they both share this same problem. We have seen clinical tests in which a raw score change of 1-2 points can result in a change in age- or grade-equivalent scores of half a year to a year or even more.
Academic skills can also be broadly distributed across an age or grade band, especially for older students. By 7th or 8th grade, the average range for grade equivalent scores can extend from about 5th grade to 10th grade, rendering them nearly meaningless at best, and misleading at worst.
We hope that this brief explanation helps you see that age and grade equivalency scores, rather than being an easy way to communicate functioning, seriously miscommunicate the meaning of test performance. And remember: tests don’t diagnose, clinicians do. The better we understand where our test numbers come from and what they mean, the better we’ll be able to communicate the implications.
Learn more about TILLS
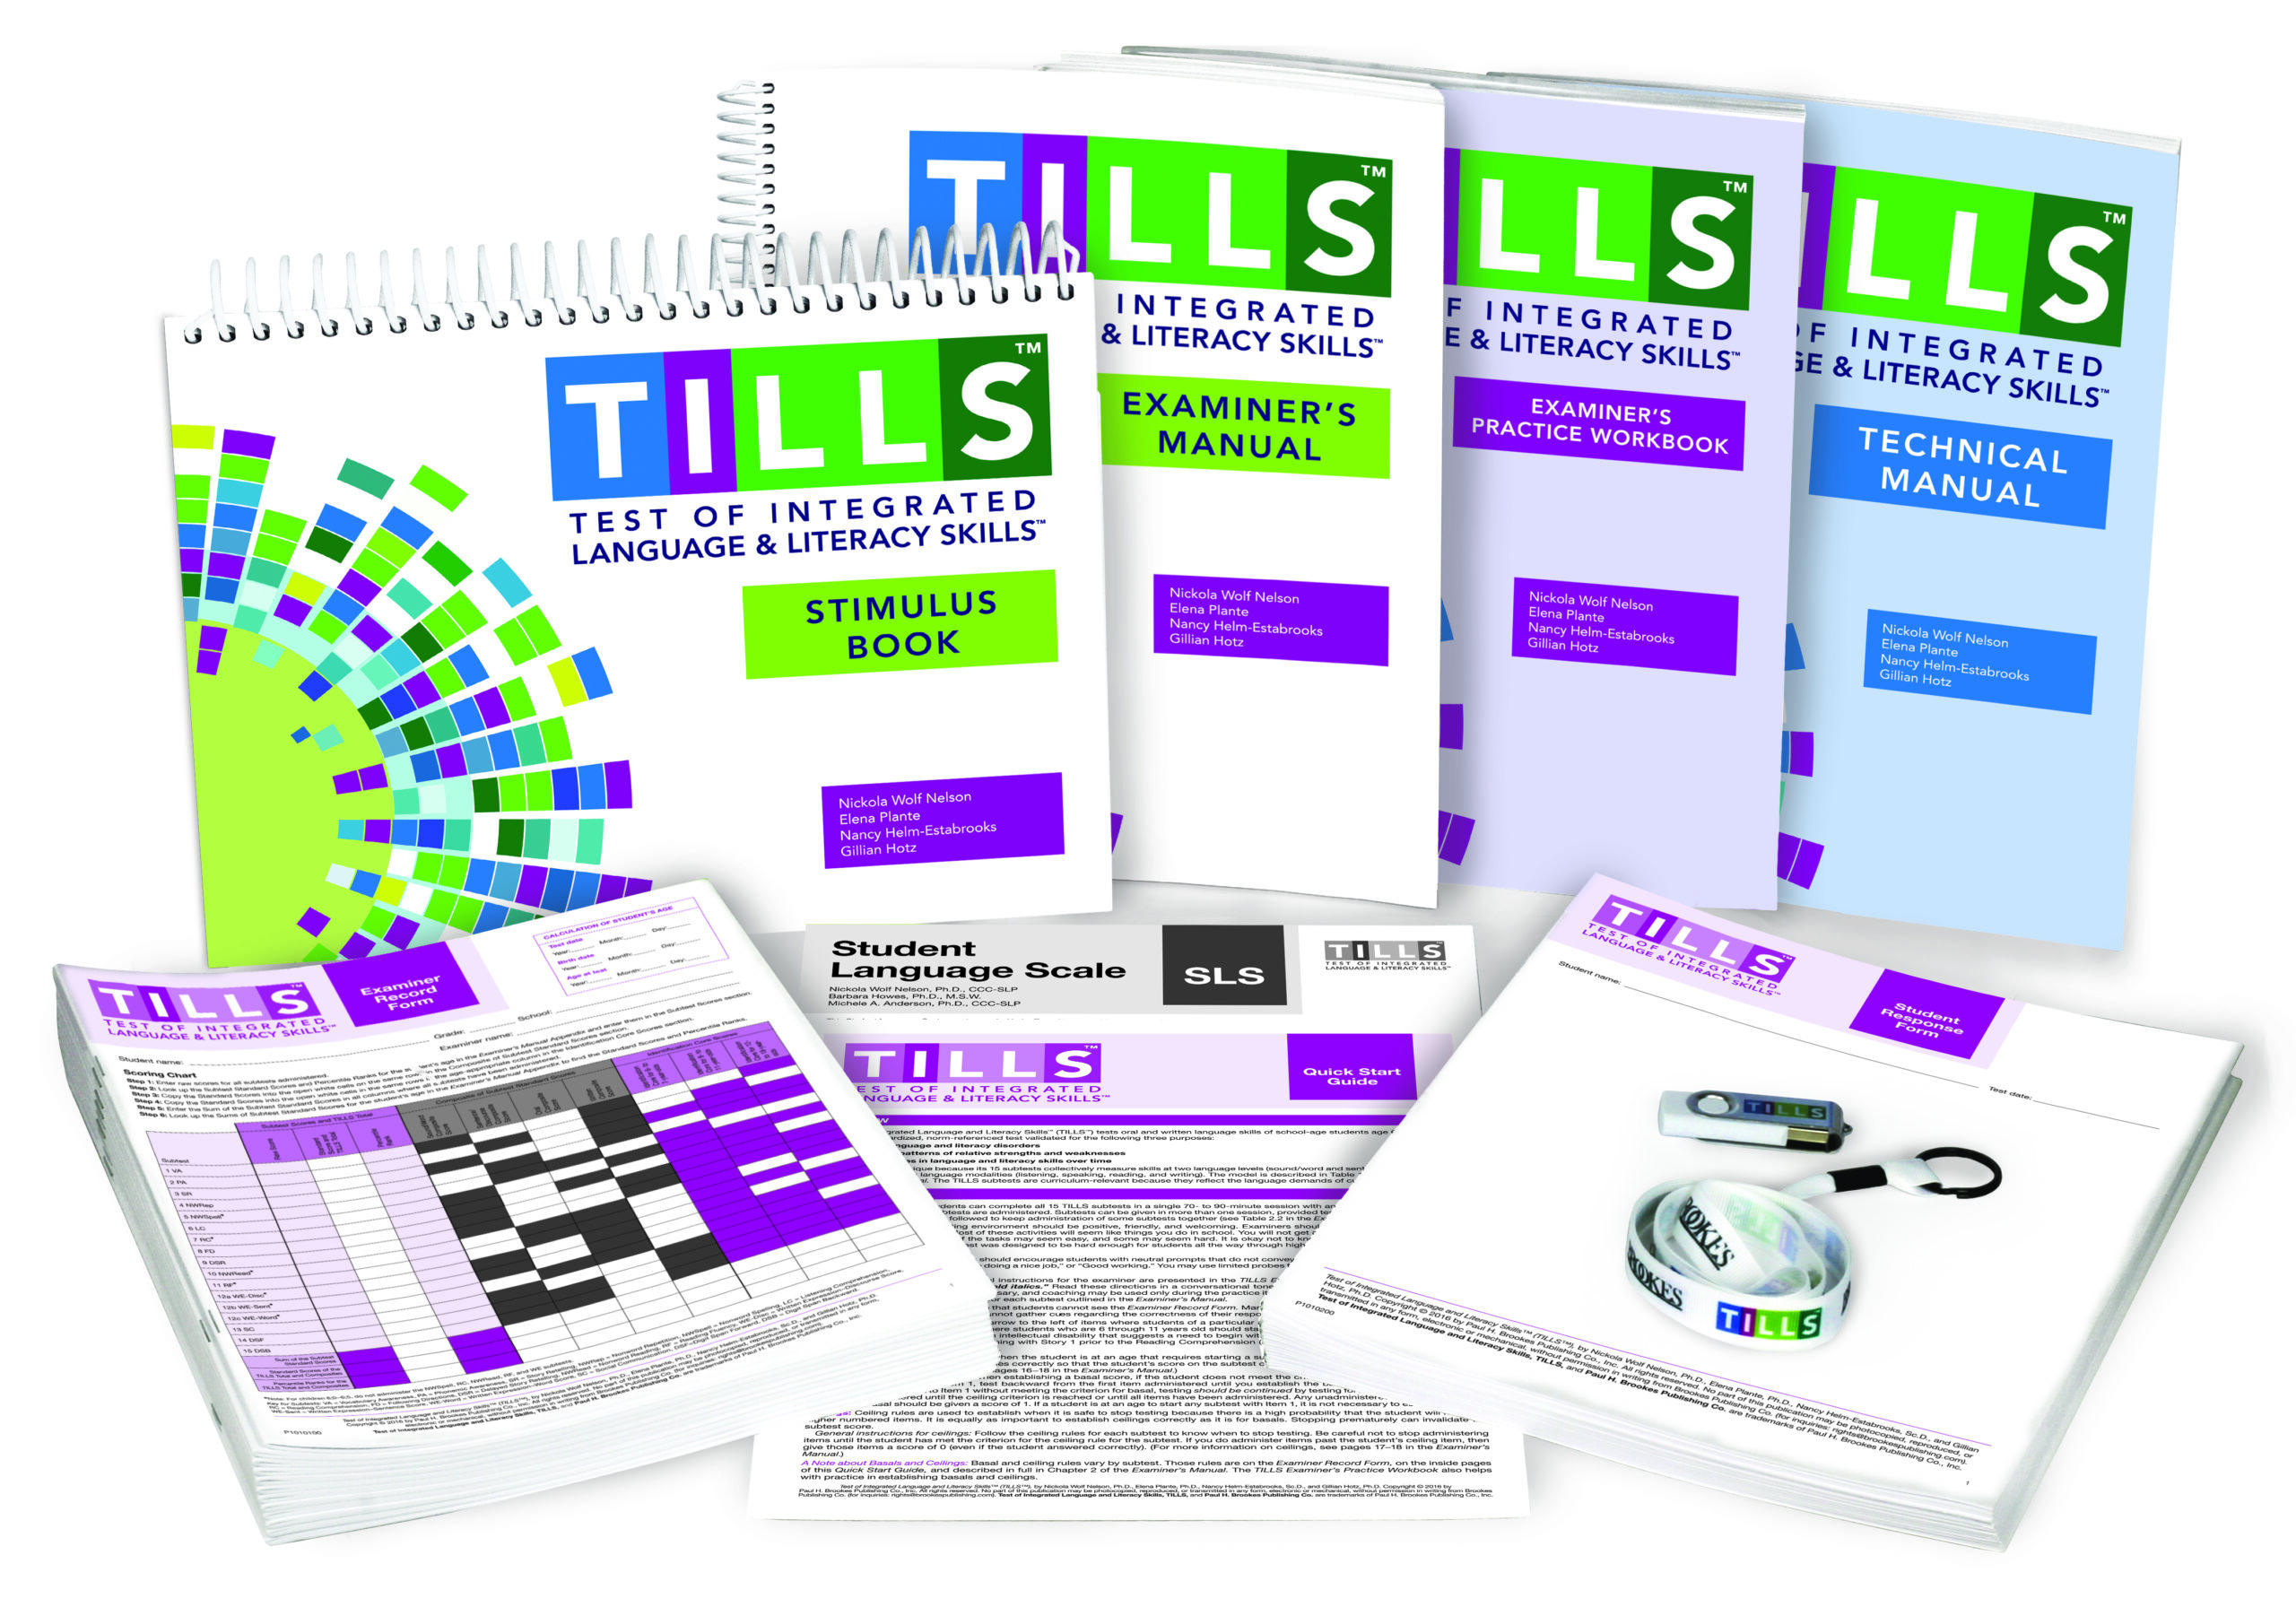
Developed by a team of highly respected experts (Nickola Nelson, Elena Plante, Nancy Helm-Estabrooks, and Gillian Hotz), TILLS tests oral and written language skills in students ages 6–18 years. It’s used to identify and diagnose language and literacy disorders (including dyslexia and developmental language disorder), document patterns of relative strengths and weaknesses, and track changes in language and literacy skills over time.
Visit the TILLS website for an introductory webinar, FAQs, a 28-page sampler, case stories, an extended FAQ, and much more.
More posts like this
5 Common Errors Every TILLS User Should Avoid
August 22, 2024
5 TILLS Tips Every User Should Know
July 11, 2024
Write a Comment
Your email address will not be published. Required fields are marked *
Post a Comment